GRAPHICS FOR LOCAL GOVERNMENTS
Design, infographics and visual journalism solutions for local and regional government clients.
City of Walnut Creek, CA
Walnut Creek Works: The 2016-2018 Budget Story


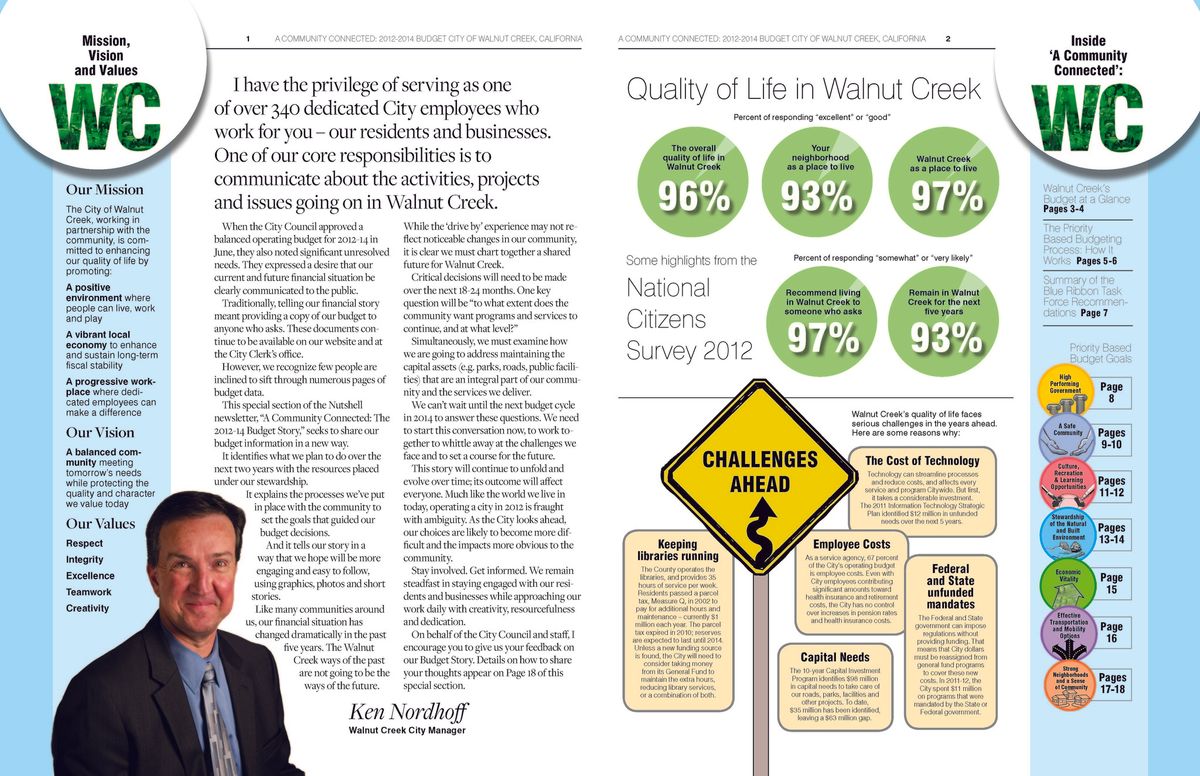
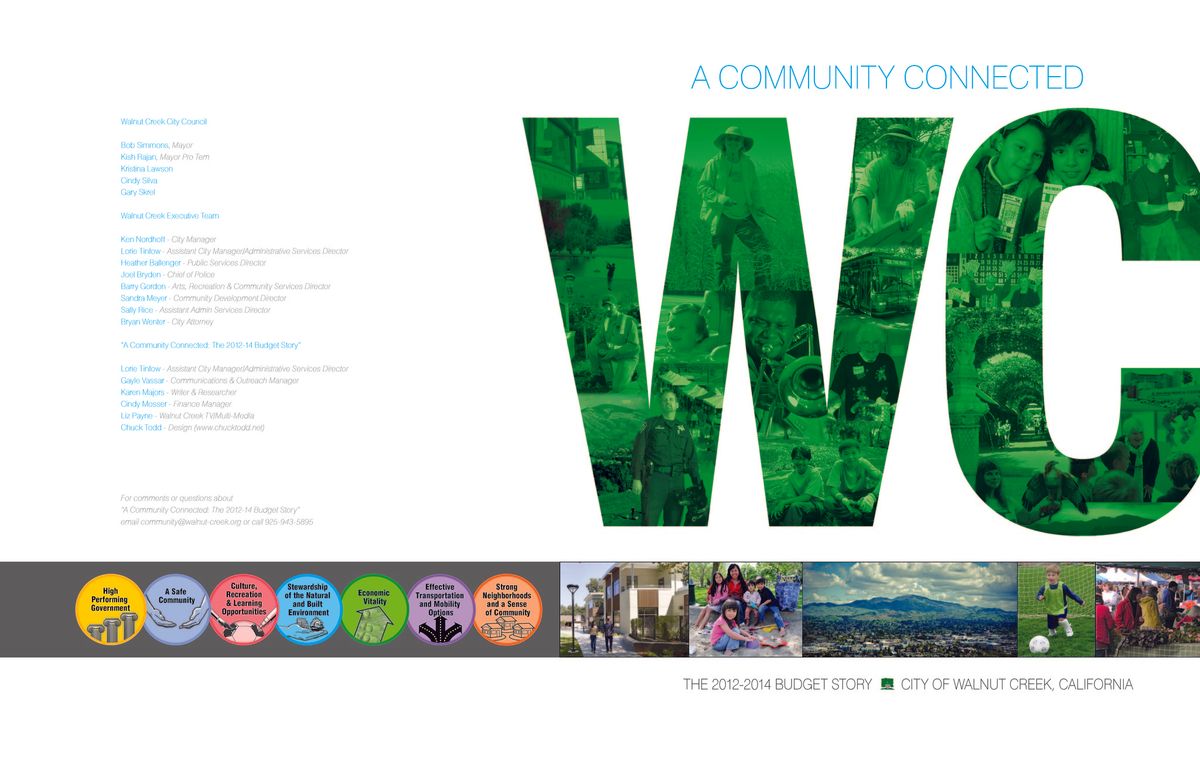
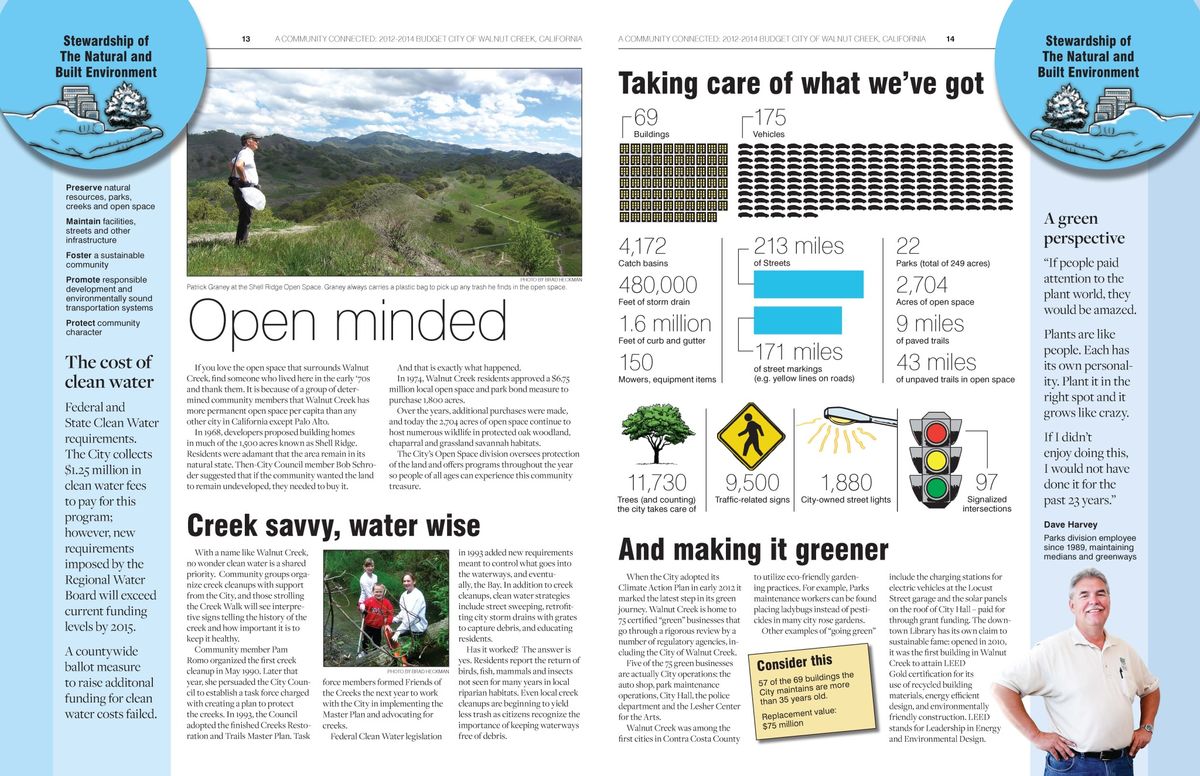
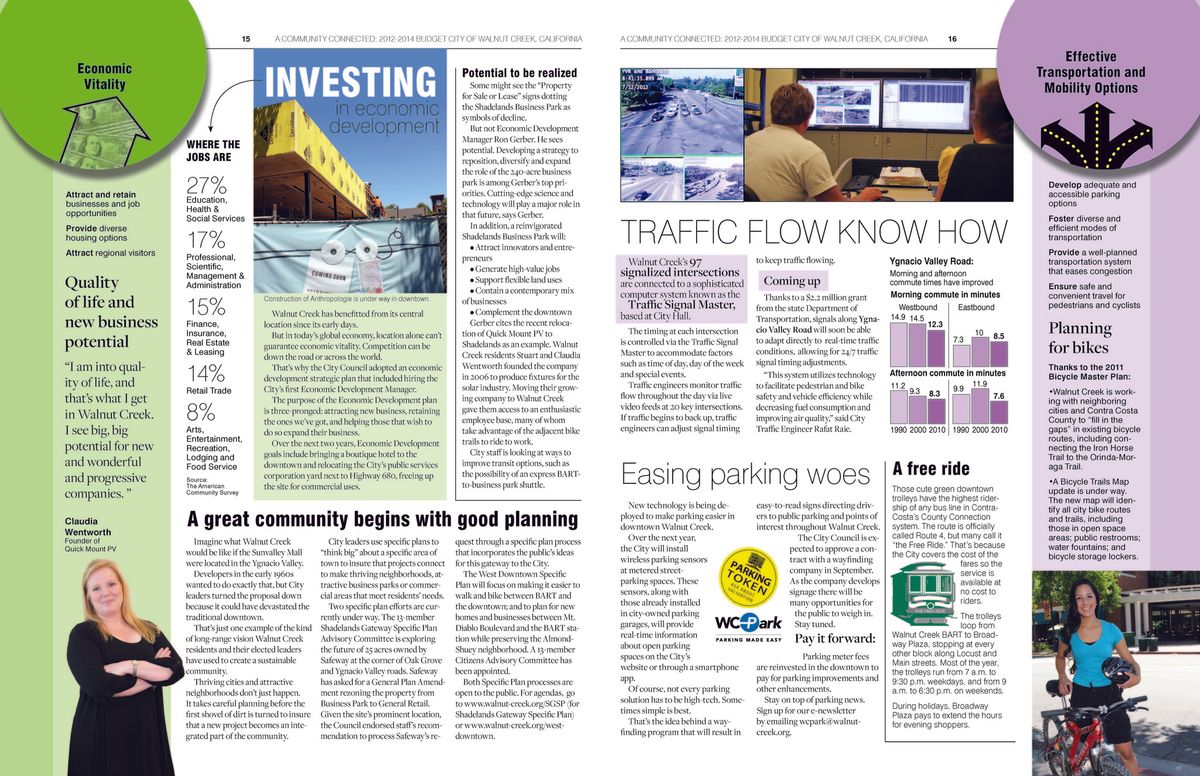
A Community Connected: The 2012-2014 Budget Story


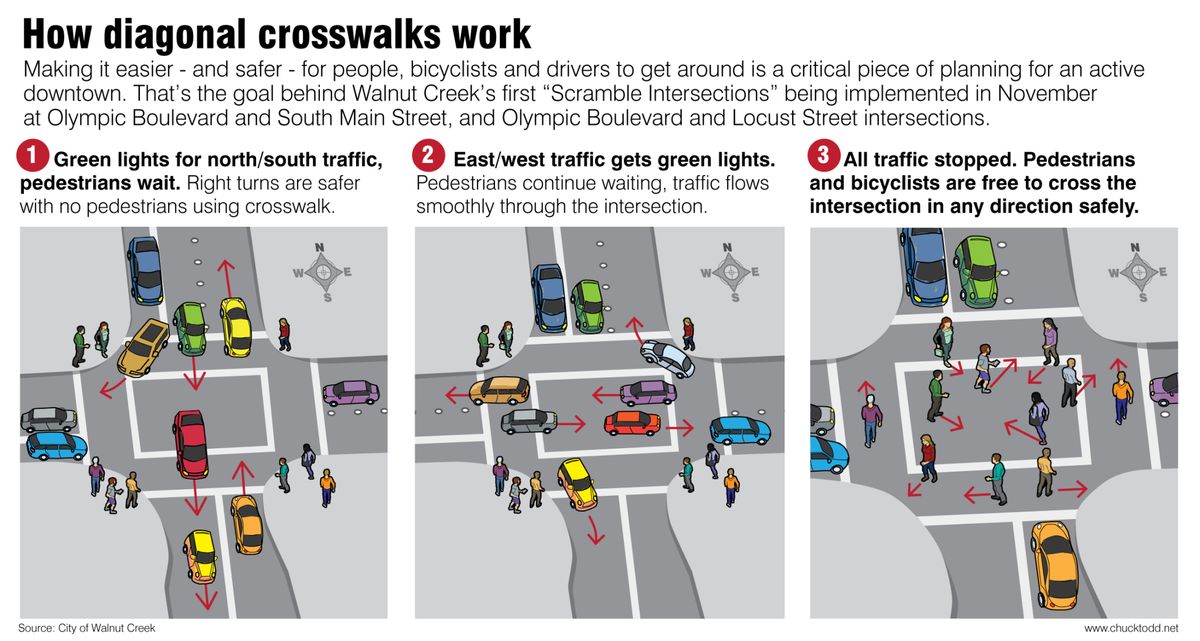
Infographics explainer on Diagonal Crosswalks

Standalone infographic

4-Page Publication:
Challenges and Choices


LOOKING FORWARD, FORWARD THINKING The 2014-2016 Budget Story. Wraparound front and back cover

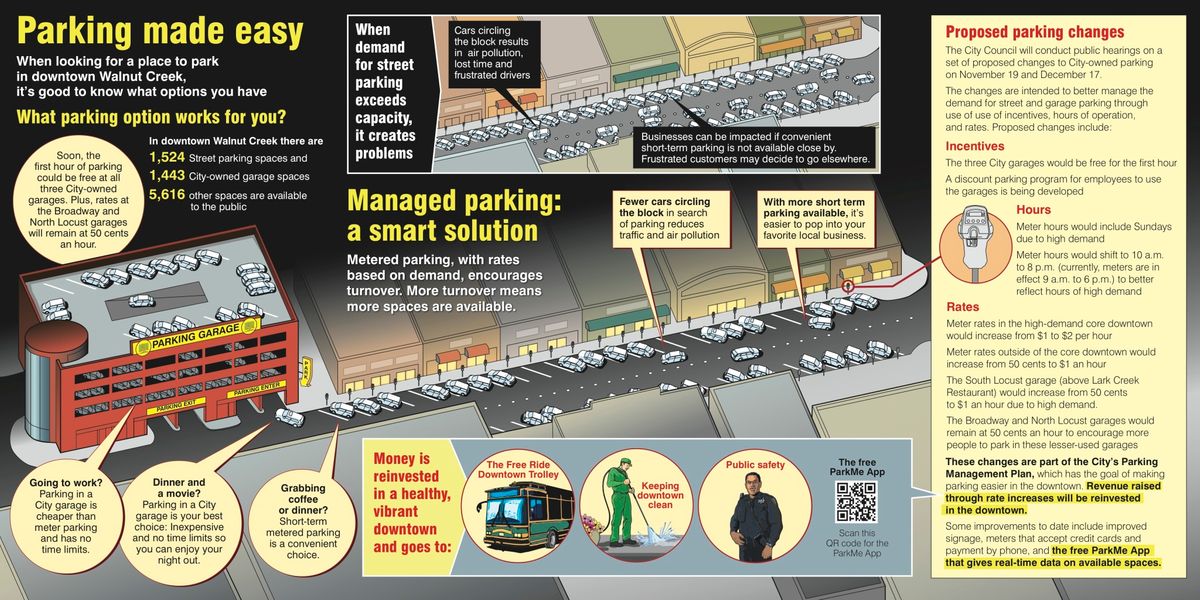
4-pages designed for the City Newsletter focusing on the topics of Parking, Traffic (2 pages) and Pensions


Utility 2.0 Project for Riverside Public Utilities
For the UTILITY 2.0 Project, the complete graphic was for use as a poster. The modular design enabled each topic section to be used as a standalone infographic for use in mailers or online.

- City of PleasantonGraphics and design work for the City of Pleasanton:

New Recycling and Pick Up Services for Pleasanton Garbage Services
About the infographics project:
These graphics were used in a PGS newsletter, the Pleasanton Progress newsletter, online and for recycling kiosks to communicate with customers about new pick up and recycling services being offered by PGS.

This centerpiece graphic (above) was used on the front of the newsletter.
The back of the newsletter was a full page graphic with details on the new services.


Pleasanton Progress newsletter design project


Two-page center spread with maps

City of Alameda, CA
Design and infographics work created for the City of Alameda
City of Alameda Mid-Cycle Budget Update and Budget in Brief


Build, Deliver, Serve
The City of Alameda's 2017-2019 Capital Budget


City of Pleasant Hill, CA
A designed display with information on a new library project.

GRAPHICS FOR LOCAL
GOVERNMENTS
Here are some of the projects I've created for local and regional governments using visual journalism, infographics and design to communicate and connect with citizens.
Projects for the City of Walnut Creek, California.